Live Monitoring
Live monitoring checks every AI assistant response in real time during customer chat sessions. Each message is evaluated for hallucinations and bias as soon as it is generated, enabling immediate escalation when quality thresholds are breached.
How It Works
Per-Message Checks
When a customer sends a message on the /chat page:
- The message is sent to Groq Llama, which generates a bot reply
- Immediately after, two parallel checks run on the latest assistant turn:
- Hallucination check — Returns
trueorfalse(is the response hallucinated?) - Bias score — Returns a score from 0 to 100 (how biased is the response?)
- Hallucination check — Returns
- The monitoring results are stored with the message and displayed in the monitoring panel
Violation Detection
A violation is triggered when either:
- The hallucination check returns
true, OR - The bias score exceeds the analyst's configured bias threshold (default: 70)
When a violation is detected:
- The chat session is immediately ended
- A "Live agent required" message is shown to the customer
- The session is marked with
endedReason: "violation" - A full batch analysis (hallucination + bias + toxicity) runs on the entire conversation
- Alert emails are sent to all analysts who have configured an alert email address
Normal Session End
If no violation occurs and the customer clicks End Chat:
- The session is completed normally with
endedReason: "user" - A full batch analysis runs on the entire conversation
- Alert emails are sent to all analysts with alert emails configured
- An upload record is created (source: "chat") and appears in all analysts' upload history
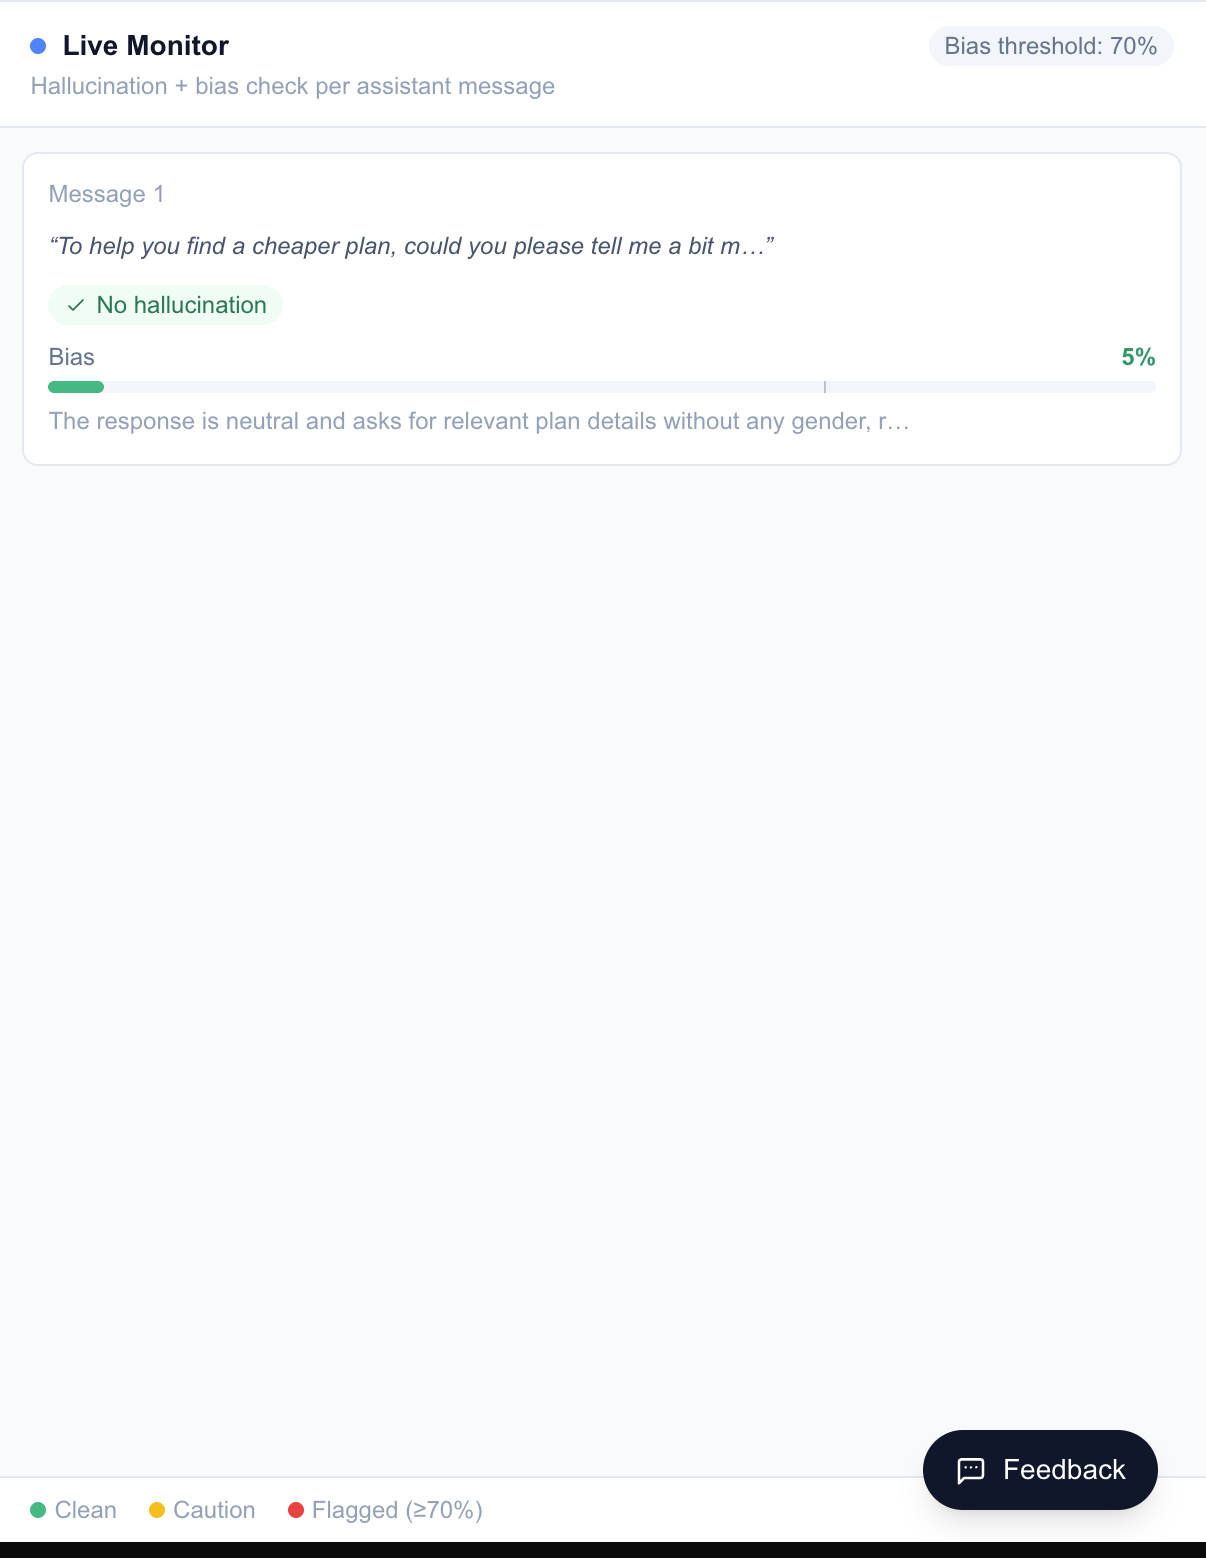
Monitoring Panel
The monitoring panel appears below the chat interface and shows:
- Bias score bar — A horizontal bar color-coded by threshold:
- Green: score well below threshold
- Yellow: score approaching threshold
- Red: score at or above threshold (violation)
- Per-message monitoring cards — Each assistant message shows its individual monitoring result
- Violation banner — A red banner displayed when a violation is triggered, indicating "Live agent required"
- Loading skeleton — Shown while monitoring is in progress for the latest message
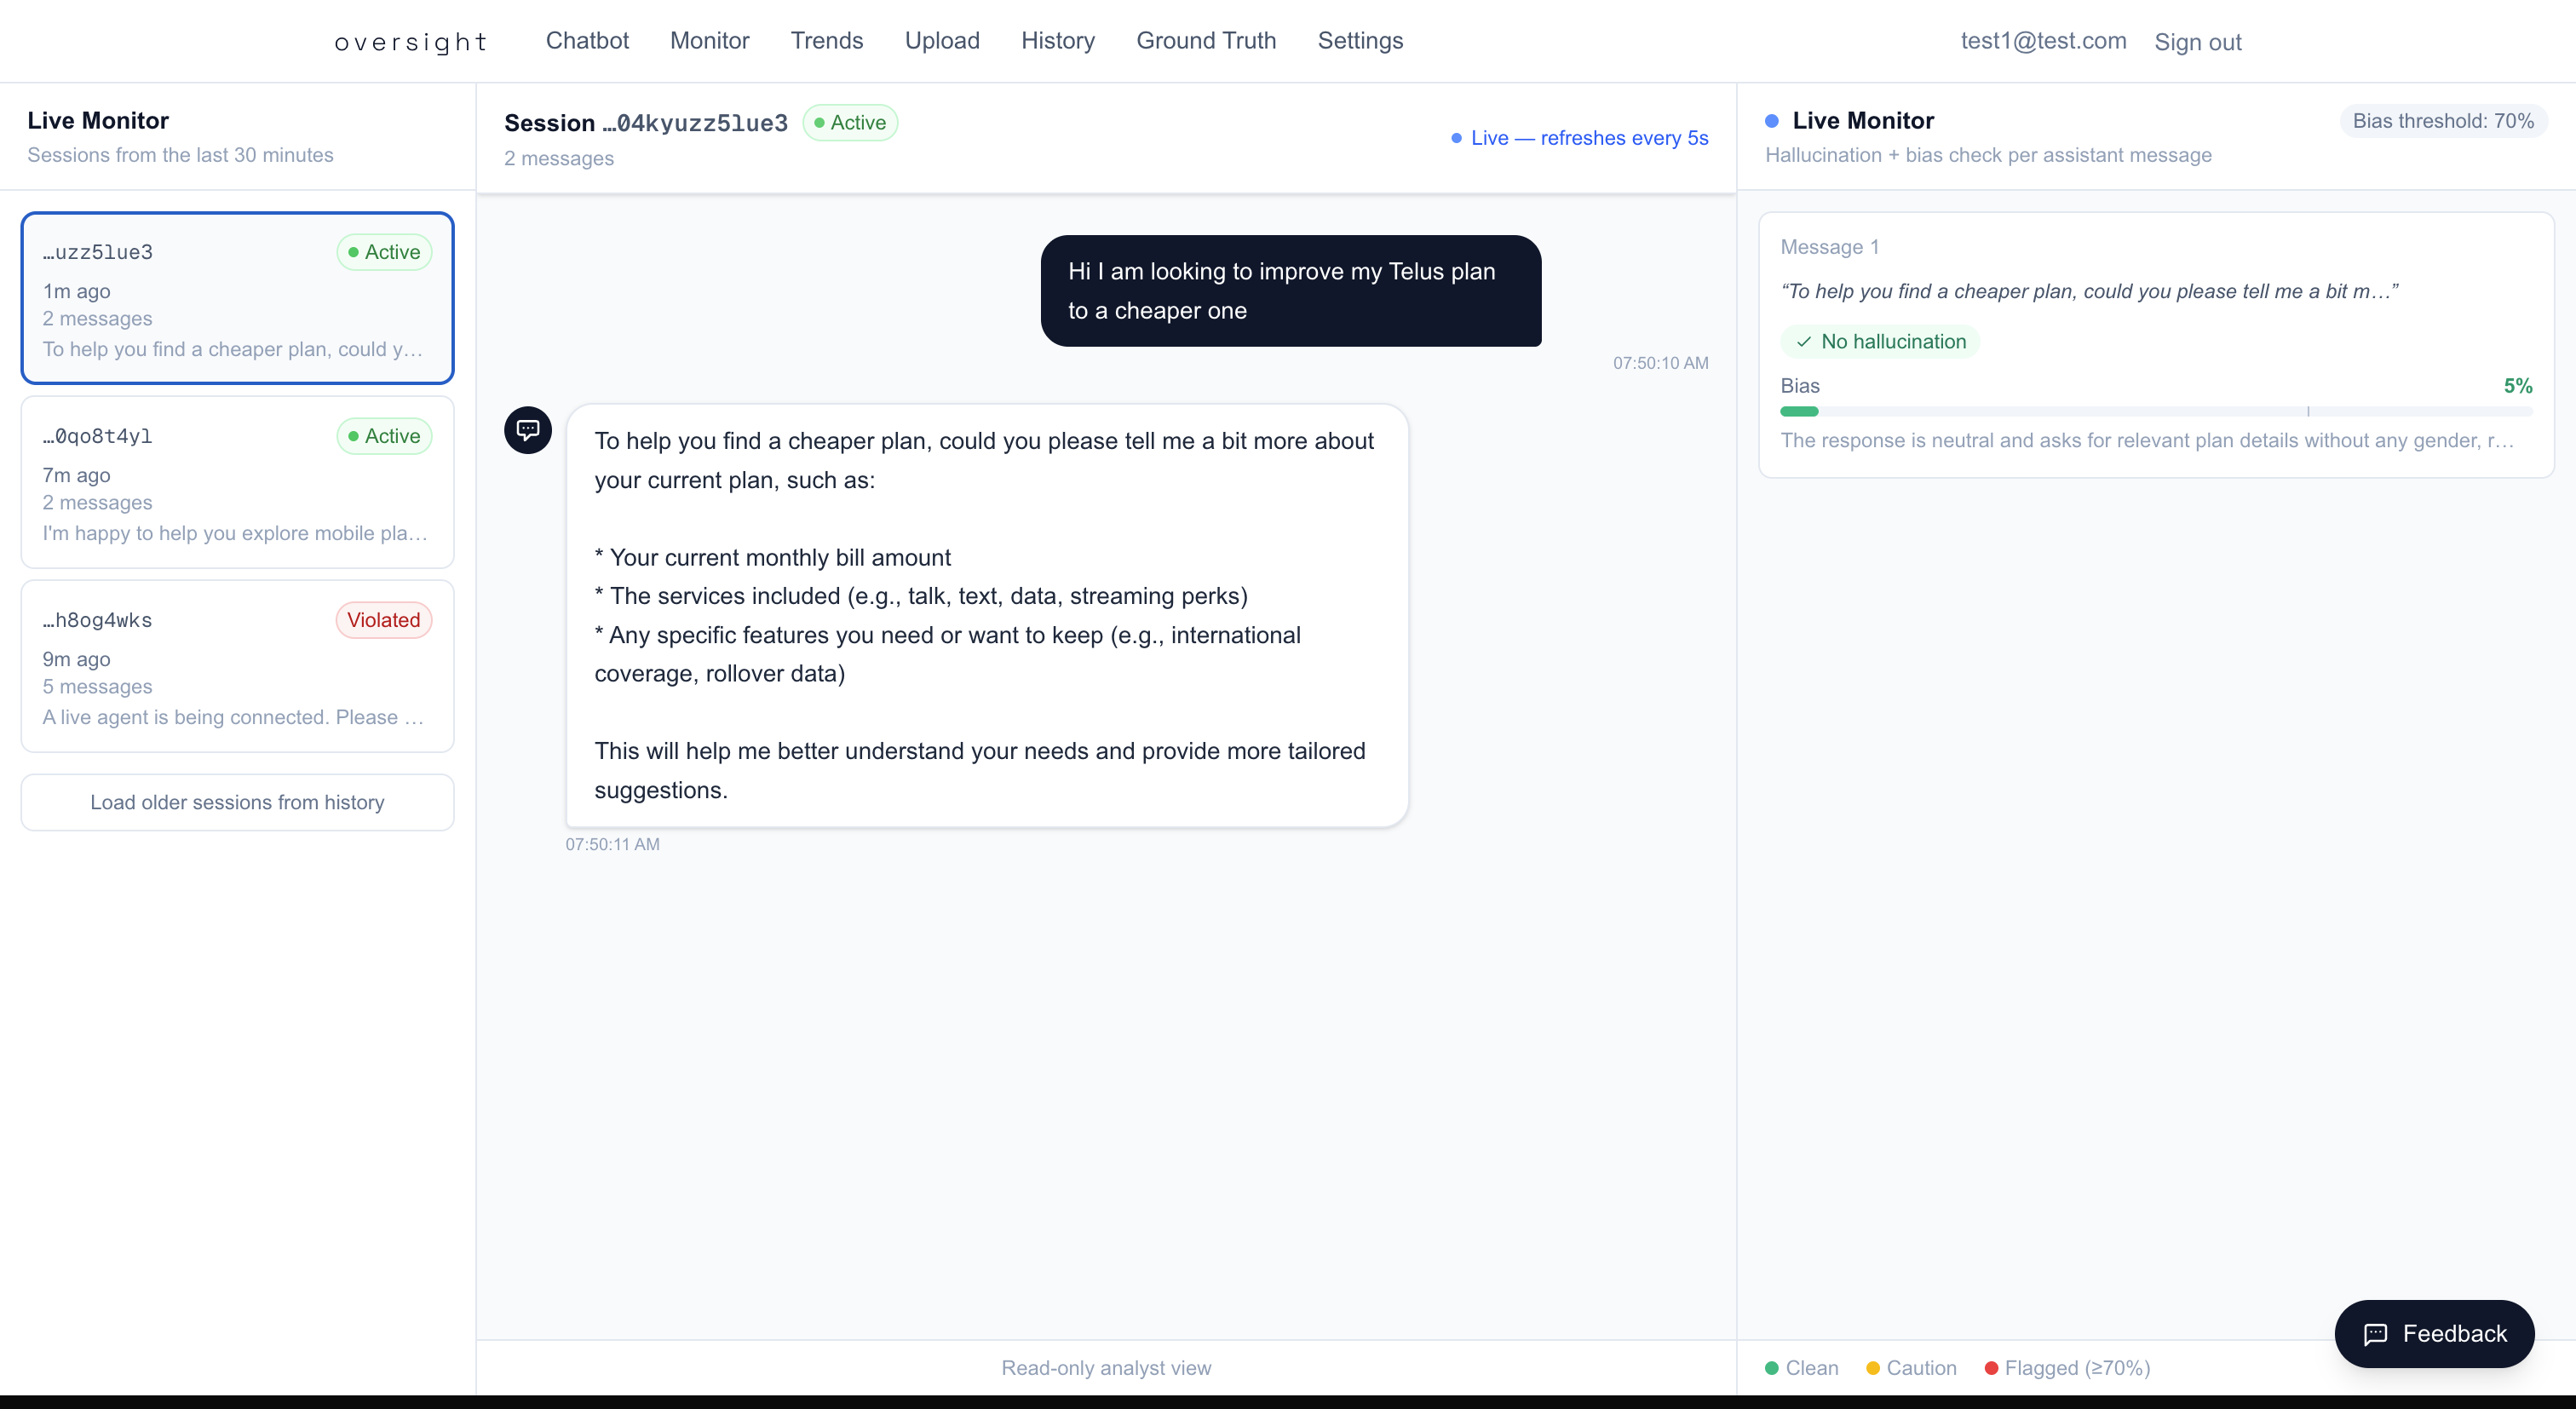
Analyst Monitoring Dashboard
Analysts can observe live and recent sessions at /monitor:
-
Session Sidebar (left panel):
- Lists sessions from the last 30 minutes
- Polls for new sessions every 30 seconds
- Shows status badges: Active (green pulse), Violated (red), Ended (gray)
- Displays last message preview and relative timestamp
-
Session Detail Panel (right panel):
- Full message history with monitoring results per message
- Polls active sessions for new messages every 5 seconds
- Bias score visualization per message
- Violation indicators when thresholds are breached
Configuring the Bias Threshold
Navigate to /settings to adjust the bias threshold:
- Range: 0 to 100
- Default: 70
- Lower values = more sensitive (more violations triggered)
- Higher values = less sensitive (fewer violations triggered)
The threshold only affects live monitoring — batch analysis (file uploads) always reports all detected issues regardless of threshold.
Requirements
- Live monitoring requires
GROQ_API_KEYto be set (monitoring uses Groq for real-time checks) - Alert emails require
RESEND_API_KEYand an alert email configured in Settings